
Centile Chart
From a child's clinical record, you can display a graphical representation of the child development growth charts with the child's measurements recorded in clinical items plotted.
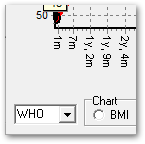
Communicare's child growth charts are based on either WHO or CDC datasets.
| WHO | CDC | |
|---|---|---|
| Dataset | 2007 child growth data published by the World Health Organisation. For more information, see http://www.who.int/childgrowth/en/ and http://www.who.int/growthref/en/ | 2000 child growth charts published by the Centre for disease control and prevention (CDC) |
| Data starts from | Birth | 2 years* Note: |
| Data includes | BMI, Height, Weight, Head Circumference | BMI, Height, Weight |
| Centiles | 1, 3, 5, 15, 25, 50, 75, 85, 95, 97, 99 | 3, 5, 10, 25, 50, 75, 90, 95, 97 |
| Example | 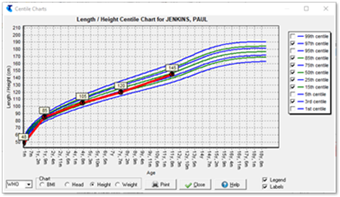 |
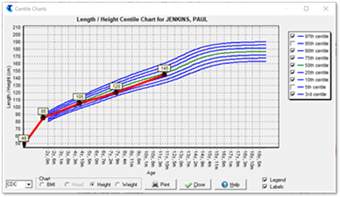 |
Centile charts show the position of a measured parameter within a statistical distribution and are useful for plotting changing parameters, such as assessing a child's height or weight over time. They do not show if a parameter is normal or abnormal, rather how it compares with that measurement in other individuals. For example, if a child's height is on the 25th centile, for every 100 children of that age, 25 would be expected to be shorter and 75 taller.
- The patient's measurements are plotted if they are recorded in a clinical item such as Check up;height/weight that includes measurement qualifiers for height, weight and head circumference (WHO only).
- The Weight chart includes a birth weight if one has been entered in biographics or the Birth details clinical item.
- The centile charts are appropriate for the sex of the patient. If sex is not recorded, no centile charts are displayed.
- BMI is plotted only if it has been calculated in a clinical item.
- The length/height-for-age charts are discontinuous between 730 and 731 days, where the measurement changes from recumbent length to standing height at the age of two years.
- *Communicare does not
publish CDC data for children younger than 2 years. The CDC itself states:
The WHO growth standards are recommended for use with children younger than aged 2 years
. (Using the WHO Growth Charts: Recommendations) The CDC further states:
(Using the WHO Growth Charts: Summary)Using the WHO growth standard for infants and children birth to aged 2 years has several advantages over the CDC growth reference for children of the same age including:- The WHO growth standard charts utilize growth of the breastfed infant as the norm for growth.
- The WHO standards are based on high quality data collected for children younger than aged 2 years.
To view the centile charts, in the patient's clinical record, on the toolbar, click
 .
.

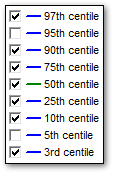
To hide the centile key, deselect Legend.
To remove labels for the child's measurements, deselect Labels.